Visualising car accidents around Melbourne, VIC using Kepler.gl

Data Visualisation with kepler.gl

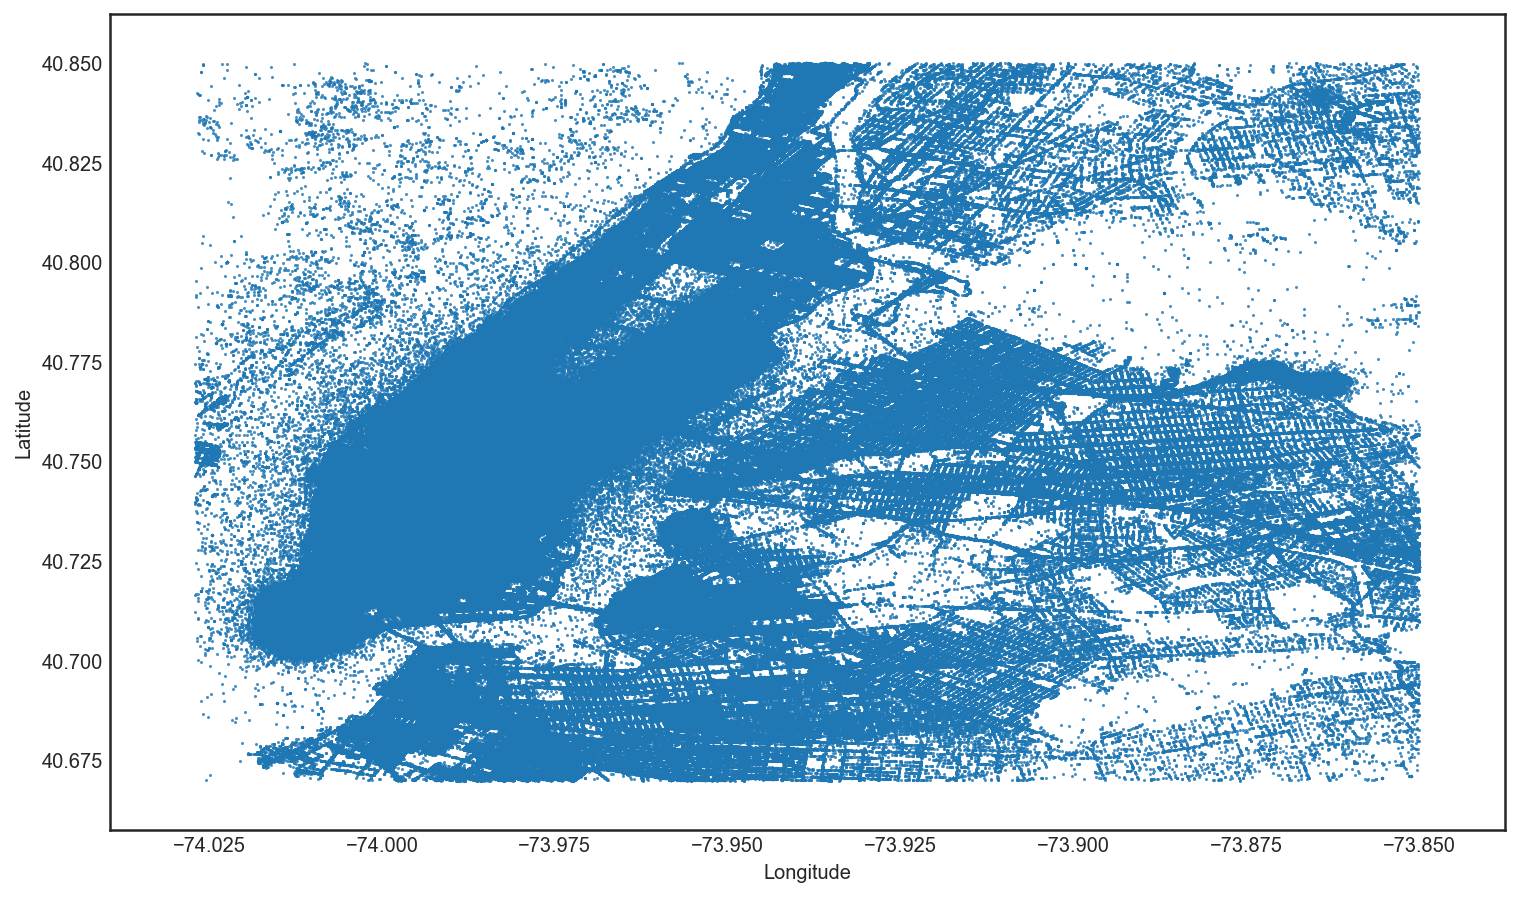
Using Uber’s recently released geospatial visualisation tool Kepler, we are able to generate beautiful map based visualisations, such as the chart below which shows traffic accidents involving pedestrians in Melbourne, Australia over the past 4 years.
Read More

Fast(er) ai

Jeremy Howard’s fast.ai Study Group, Q1 2018

In February, I was invited by Sydney Machine Learning’s Paul Conyngham, to join a Saturday morning study group to tackle the first seven weeks of Jeremy Howard’s fast.ai Deep Learning for Coders MOOC, under the kind auspices of The Domain Group. I was excited to be part of the study group, as the course came highly recommended by my mentor Greg Baker.

Read More

Predicting road accidents among Fleetrisk drivers

General Assembly Data Science Final Project

Bad drivers cost insurers and transport companies money. Predicting which drivers will have accidents is difficult. Academic research, on the impact of driver personality and cognition is focused on mature age drivers and remains untested against actual driving behavior.

Read More

Using webscraping & NLP to select predictive features for car sales

Webscraping

Like similar online automobile sales websites, https://www.carsales.com.au allow prospective car buyers in Australia to view new and second hand car sales from private sellers and/or dealerships. Car sales are organized by state, seller and car type among other features. The well structured website makes it a suitable candidate for scraping using Python’s Beautiful Soup library after which we can test whether car sales prices can be predicted using scraped features. We use Natural Language Processing courtesy of Python’s nltk library to determine whether any words in the seller’s description of the car are more or less helpful in predicting car price.

Read More

Clustering and Classification Analysis (Updated)

Summary

For the unsupervised learning problem I use a K-Means algorithm to distinguish individual clusters of data by maximising the silhouette coefficient. When the dimensions of the original dataset are reduced using PCA, two clusters of datapoints are quite close to one another (similar variances) along the first principal component and are grouped into a single cluster by K-Means. A density based algorithm fares better at identifying three clusters but depending on the parameters certain datapoints are as classed as outliers. The classification task is complicated by an imbalanced class. 70% of the target variable is of Class 1 meaning that a model that classifies every value of the target variable as 1 will have an accuracy of 70%. Since the area under an ROC AUC curve is insensitive to imabalanced classes I use a hypertuned Logistic Classifier to maximize this metric and identify the most important features. This classifier outperforms a KNN Classifier on both the training and test data sets.

Read More

Predicting house prices with the Ames dataset

Kaggle Competition - Advanced Regression Techniques

The Ames Housing Dataset is used by Kaggle (https://www.kaggle.com/c/house-prices-advanced-regression-techniques) participants to use multiple regression techniques to predict house prices given a set of features. It is the “Hello World” of Data Science problems.

Read More

Two Exploratory Data Analysis examples

Data Visualization

Visualization is my favorite part of Data Science. I get more insight from a figure than by staring at rows of data. This notebook is a small taste of the visualization capabilities of Python to solve two ‘toy’ Data Science problems.

Read More