Predicting road accidents among Fleetrisk drivers
General Assembly Data Science Final Project
Bad drivers cost insurers and transport companies money. Predicting which drivers will have accidents is difficult. Academic research, on the impact of driver personality and cognition is focused on mature age drivers and remains untested against actual driving behavior.
Fleetrisk screens new drivers based on cognitive, emotional and personality tests. In my sample, 394 of these drivers were monitored for six months on daily road trips, with vehicle telematics data collected from sensors fitted to their cars. 52 of these drivers had road accidents over this period. Can I use Feetrisk data to determine which drivers were more likely to have accidents? Are there patterns that allow me to predict which drivers will never have an accident?
Fleetrisk Data
Fleetrisk is used by companies in the ‘lease for ride share’ business to manage and understand driver risk via computerized hazard perception tests to rank drivers cognitive, empathy and personality traits. These factors align with the Big Five personality model and provides Fleetrisk with some understanding of the psychological makeup of potential drivers.
Fleetrisk then fits these driver’s vehicles with sensors to monitor every speeding, accelerating, braking and cornering event and the speed at which these events occur. Drivers receive no real time feedback and over time will revert to normal driving behavior.
The longer people drive, the greater the likelihood of an accident occuring. Fleetrisk records each accident claim made by every driver being monitored. Our sample contains the date, severity and cost of each accident among other variables. Whether the driver was at fault or not, is not recorded.
Figure 1: Correlations between 23 driver personality factors and having an accident
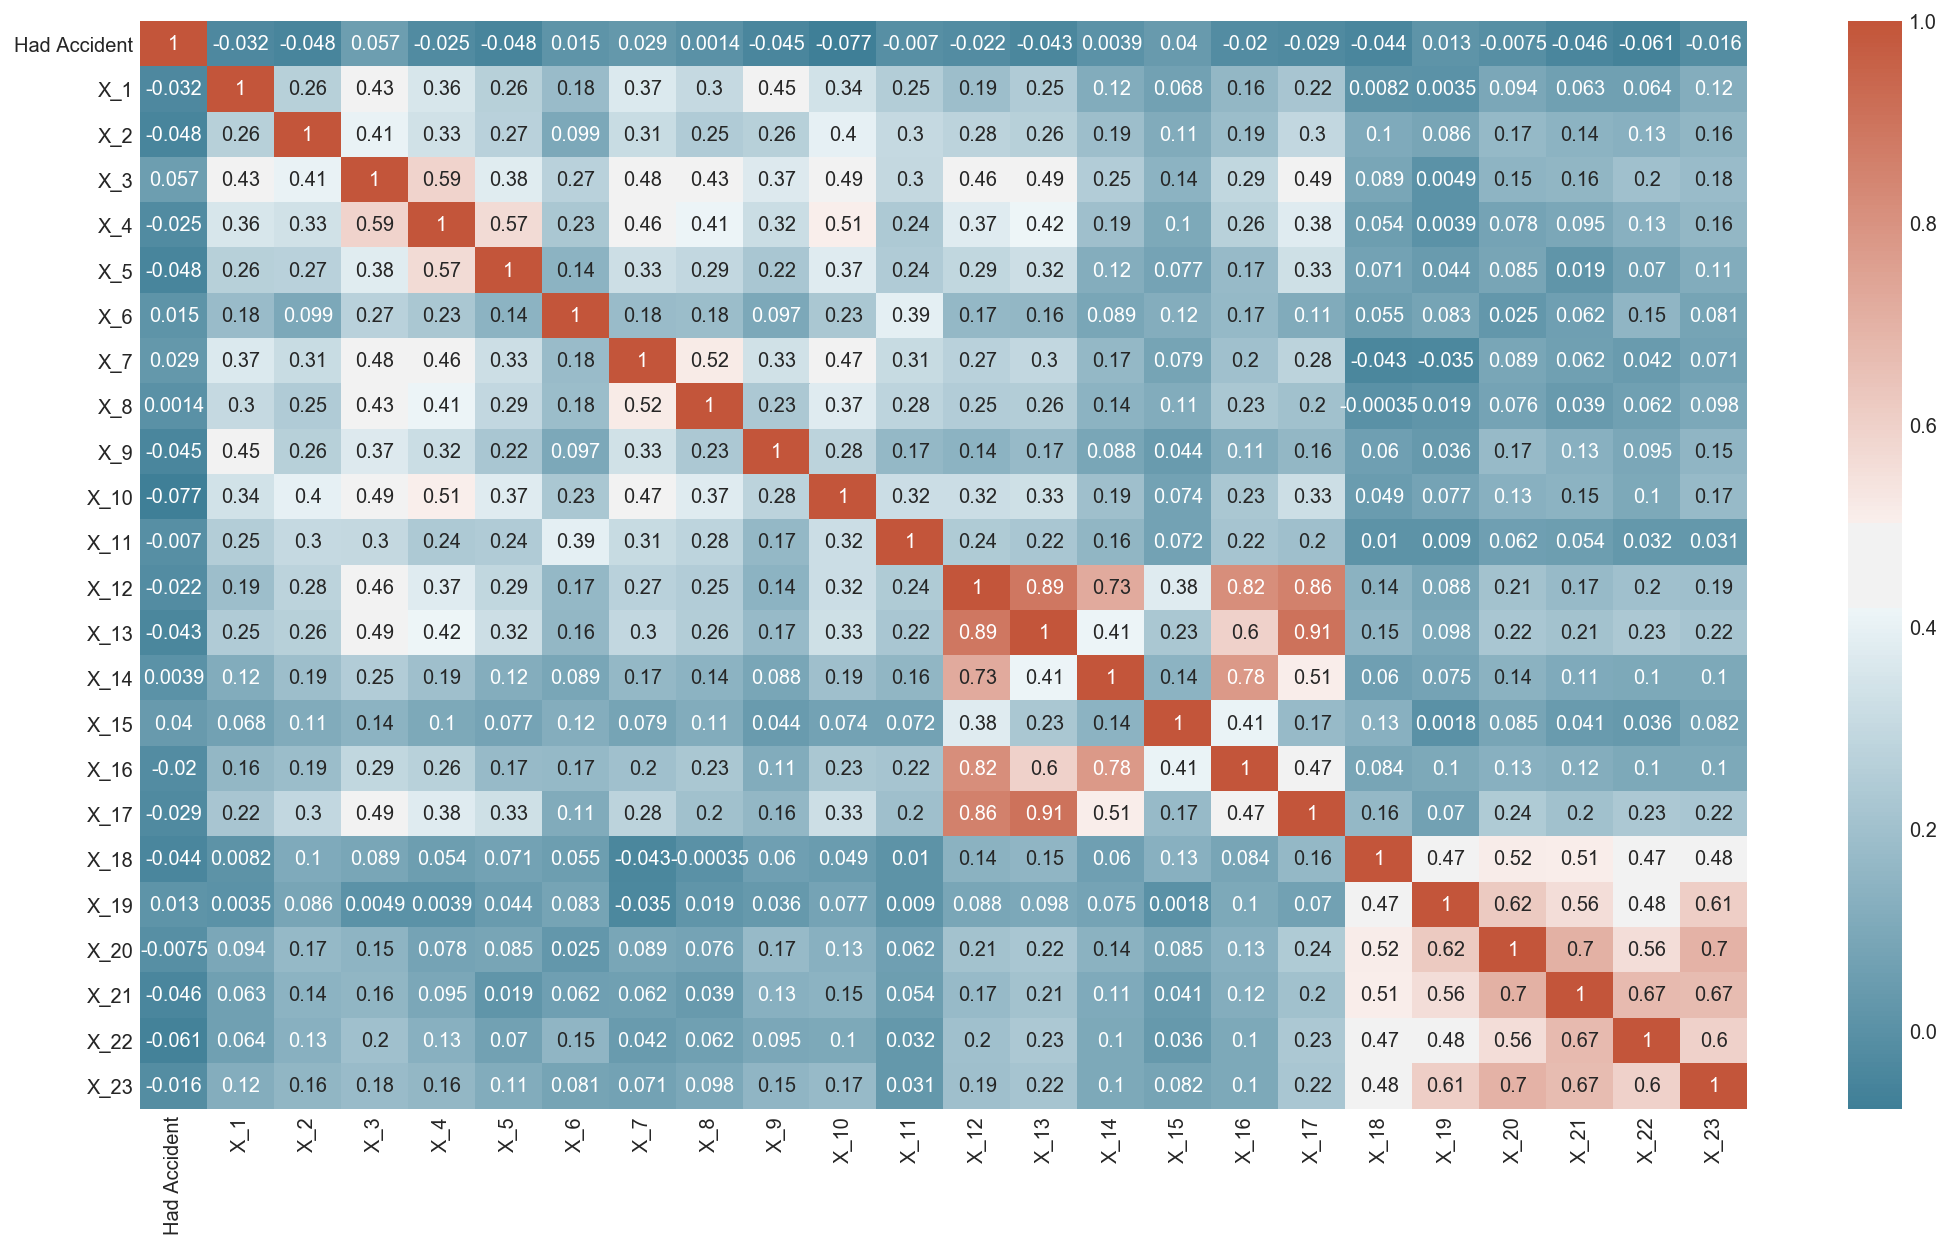
While NDAs prevent me from expliclty naming the factors, note the unanimously low correlations between all factors and whether a driver will have an accident. This does not bode well for Logistic Classification models relying on a linear combination of one or more of these personality traits.
Figure 2: OLS reveals most personality features are not significant
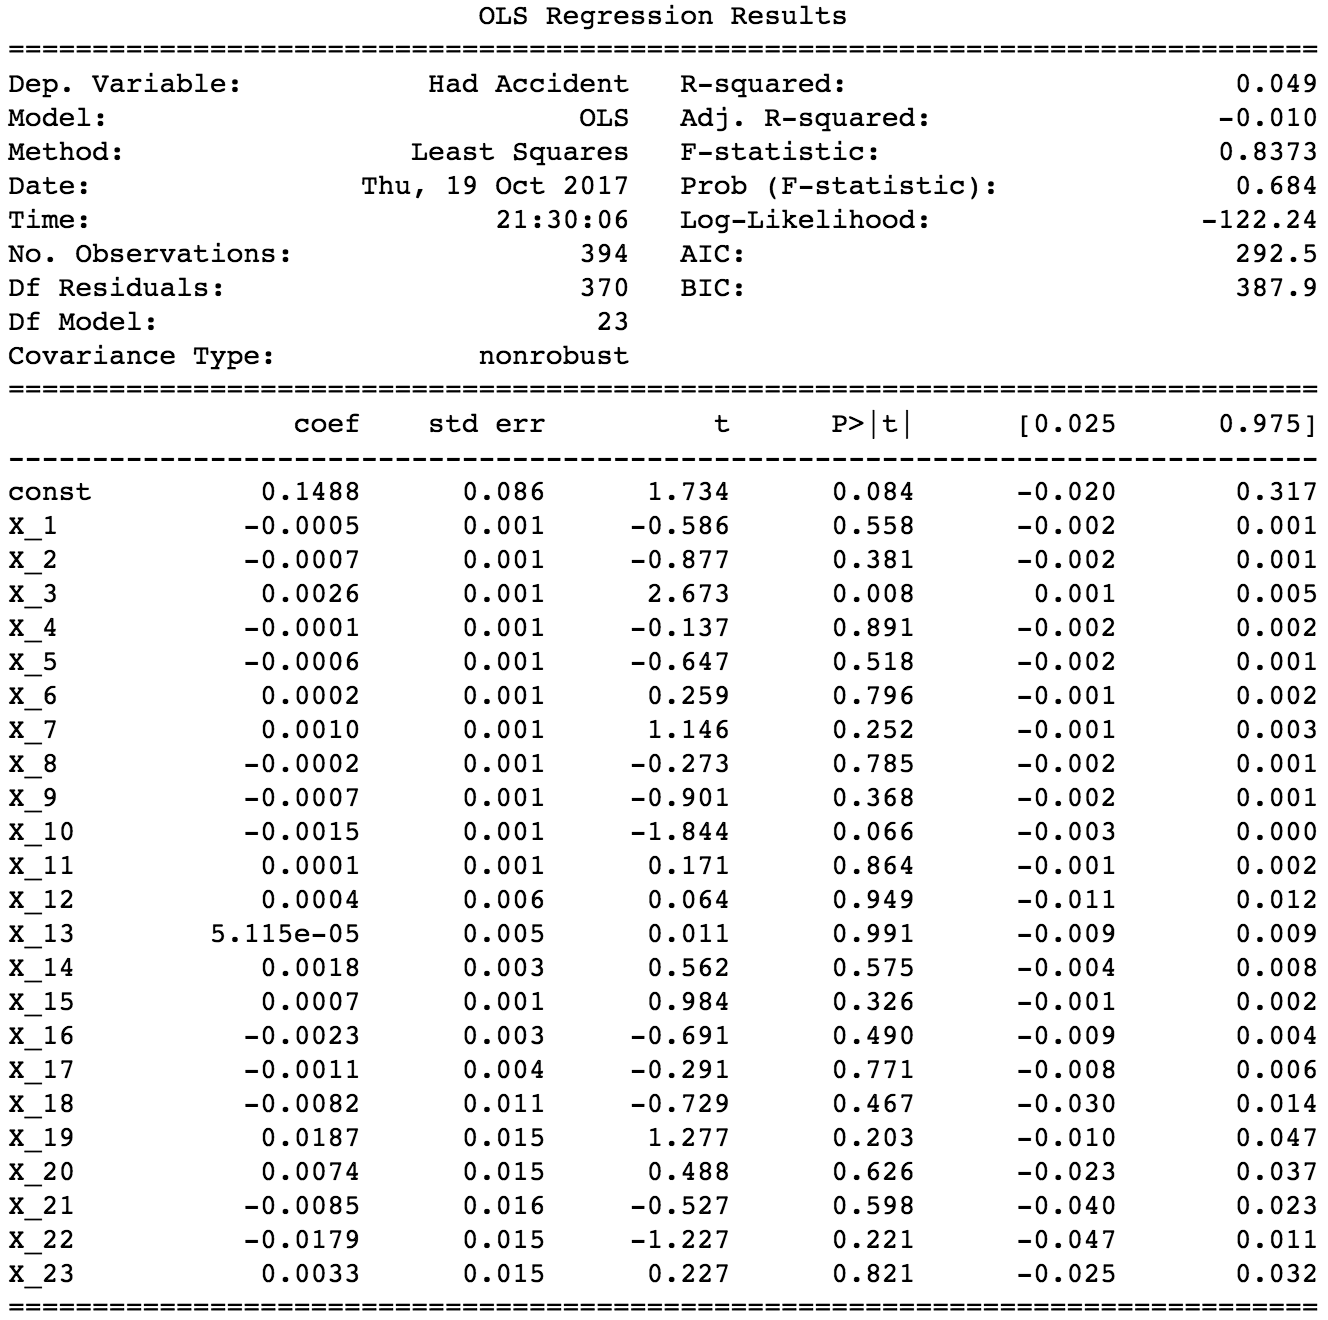
This is corroborated by a simple OLS regression model that uses whether a driver had an accident or not as the target and the personality factors as its features. I could go down the non-linear modeling route, but this risks introducing more complexity into our analysis. Logistic regression is preferred because its results are easier to interpret for a client than (say) a boosted decision tree or a neural network.
Time for some Data Science
Are there any relationships between driver personality and driving behavior, specifically how fast a driver goes? The sample contains the number of times each driver speeds. However, I’m reticent to use this feature as is, because the longer someone drives the greater the likelihood they will speed or have an accident.
We’re better off standardizing this score by this distance or time driven by each driver. Here I divide the number of times a driver speeds by the total number of hours driven and percentile rank these scores. I then create a Kernel Density Plot against a particular variable of interest.
Figure 3: Kernel Density Plot of how often drivers speed vs variable of interest
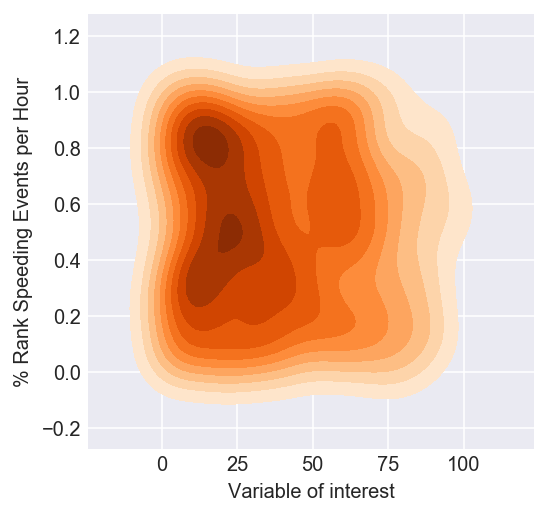
Notice 3 clusters appear:
- Low speeds and low values of the variable of interest
- Low speeds and high values of the variable of interest
- High speeds and high values of the variables of interest
What if I used a K-Means clusterer on these two variables. Would the same clusters appear?
Figure 4: Rare 4th Cluster visible
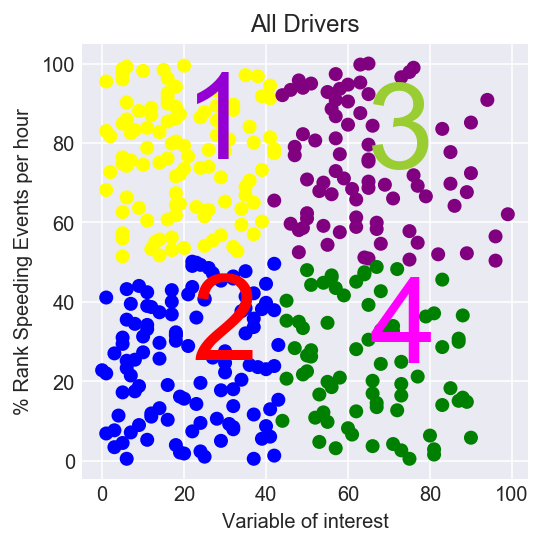
Interestingly, the K-Means clustering algorithm maps over the 3 clusters above and picks up a 4th cluster, drivers who speed a lot and have low values of the variable of interest.
Average number of accidents per cluster
| Var of interest | Low Value | High Value |
|---|---|---|
| High Speed | 16.7% | 12.5% |
| Low Speed | 13.9% | 9.5% |
Takeaways
- Drive slower
- Drivers ranked in the top 50% by this variable of interest should really drive slower
Cost Function
Only 13% of all drivers in our sample had an accident. An estimator that predicted all 394 drivers were accident free would have an 87% accuracy. This is a typical example of an imbalanced class problem, and traditional techniques to accomodate this such as upsampling the minority class would end up skewing our results.
Instead, we design our cost function around misclassifying good and bad drivers. The cost to Fleetrisk of advertising for an vetting drivers for transportation companies is $25. The median cost of an accident is $2200. Put another way, if we were to reject a driver because we believed they were going to have an accident, but they were actually a good driver, it would cost Fleetrisk $25. On the other hand if we vetted a driver as being “good” but they then went on to have an accident, the cost to Fleetrisk would be $2200.
| Predict | Actual | Cost |
|---|---|---|
| Bad | Good | $25 |
| Good | Bad | $2200 |
Note the penalty associated with bad drivers in this case is 100 times greater than with good drivers, so we’ve adjusted for our imbalanced class problem.
With this cost function in place, I use a gamut of linear and non-linear models to determine the average cost per driver to Fleetrisk and calculate the savings per driver from different models. For sake of clarity, I present three results below.
Figure 5: Savings per driver
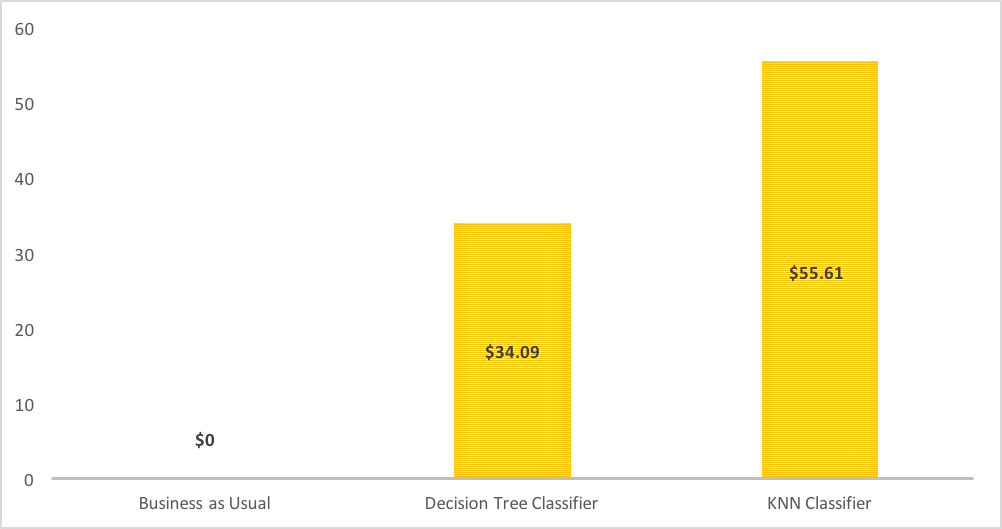
Note the KNN classification model provides the highest savings per driver. We are saying that grouping drivers based on similar attributes provides the best information to segregate good from bad drivers.
A note on Neural Networks
I fit a single layer perceptron Neural Network to this dataset of 400 drivers and while it outperforms the Logistic Classifier, it underperforms compared to the KNN regressor. The underperformance could be attributed to the relatively small size of the dataset. Given the large number of parameters needed to fit, deep learning models require large datasets for learning a hierarchical representation of the data without fitting on the train set. Splitting a small dataset into smaller training and validation set will give you even weaker indication of how good the model is at generalization to unseen data points.
The complete notebook is available here