Two Exploratory Data Analysis examples
Data Visualization
Visualization is my favorite part of Data Science. I get more insight from a figure than by staring at rows of data. This notebook is a small taste of the visualization capabilities of Python to solve two ‘toy’ Data Science problems.
1. Correlation between Teen Pregnancy Rates and SAT score
A basic project covering exploratory data analysis on the SAT verbal and math exams in each U.S. state. The SATs are a nationwide scholastic aptitude test undertaken by Year 12 students looking to gain admission to U.S. universities. SATs are required by most universities along with a student’s academic record at school and extracurricular activities to gain admission. I examined the impact of teen pregnancies on participation rates and SAT scores. SAT scores were provided. Teen pregnancy rates are births per 1000 girls aged 15-19 available from here.
Figure 1: Percentile ranking SAT participation rate, math and verbal scores & teen pregnance rate
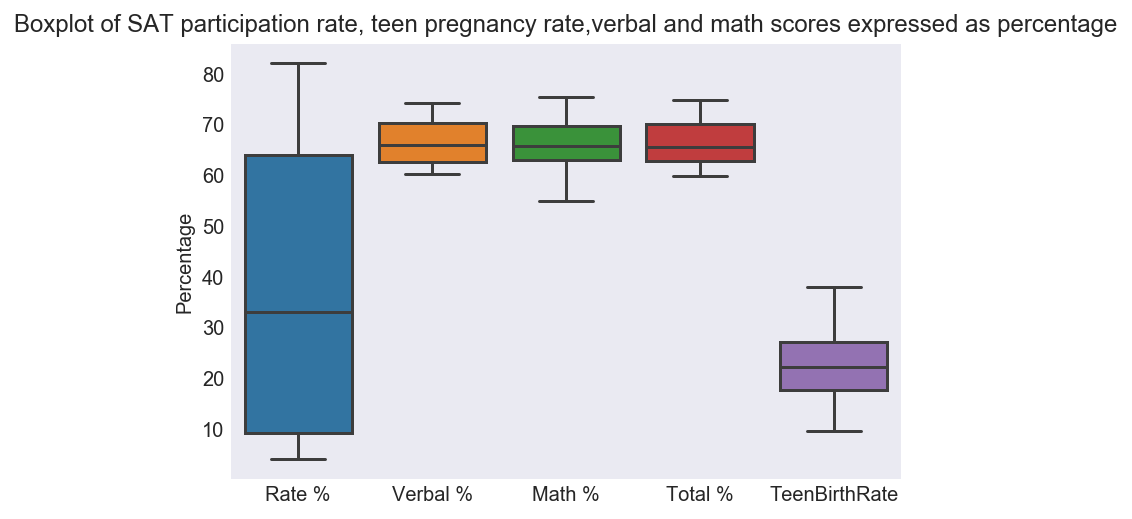
The boxplot reveals some interesting insights when it comes to the distribution of SAT scores versus participation rates. We note that the participation rate in particular has a larger range. While some states have a SAT participation rate as high as 80%, the lowest participation rate is lower than 10%.
By comparison, for students who undertook the math and verbal exams, the variance in scores is lower (compared to the participation rate). Math scores have a greater range compared to verbal scores.
Figure 2: Scatterchart of teen pregnancy rate versus SAT participation rate
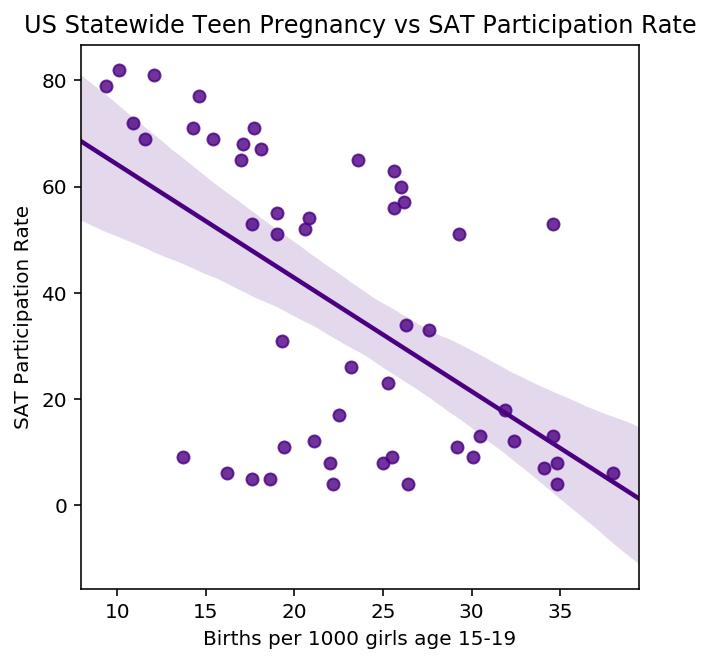
Not surprisingly, states which have a higher teen pregnancy rate, have lower SAT participation rate.
2. EDA on Drug Use data by age
Looking at the correlation matrix of drug use amongst all age groups, note the strong correlations between alcohol, marijuane and cocaine usage. It would suggest that alcohol and marijuana are gateway drugs that can lead to cocaine usage.
Figure 3: Correlation Matrix of Drug Use
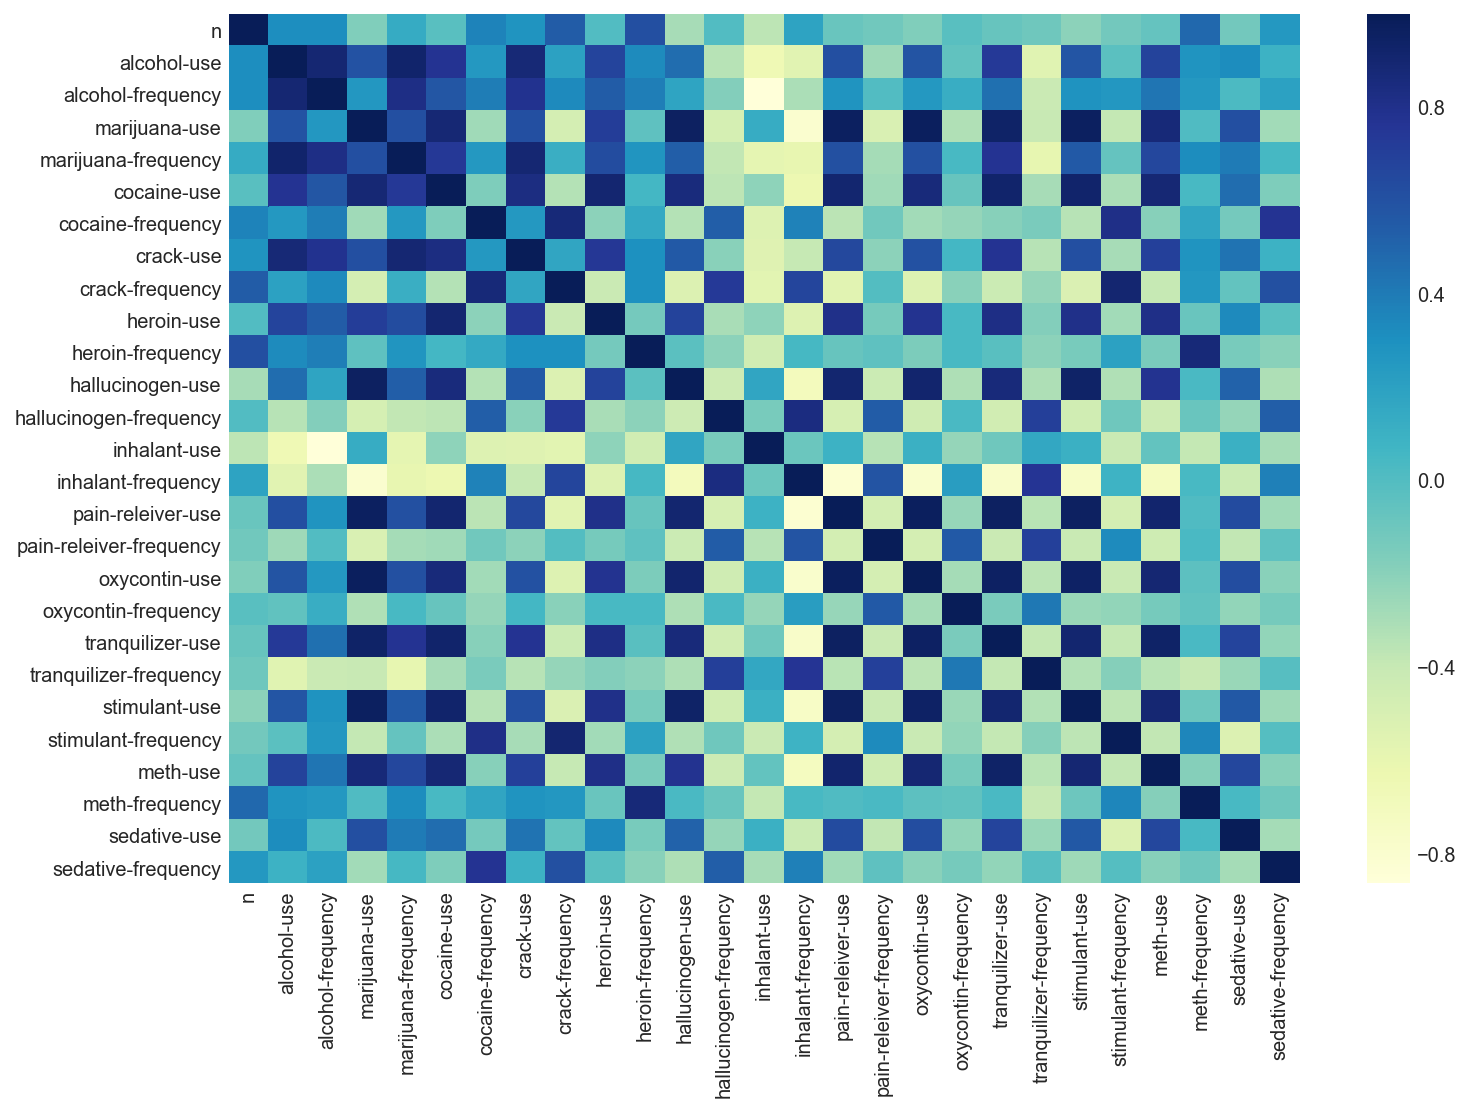
Figure 4: Alcohol and marijuana usage dwarfs all other drugs
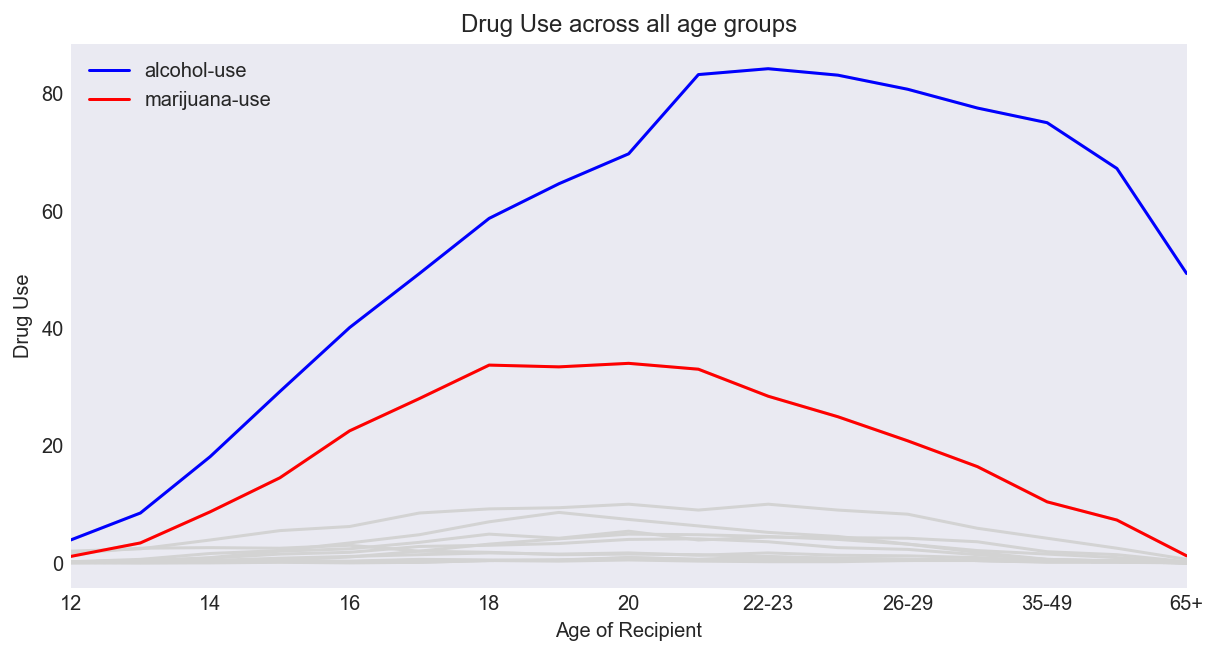
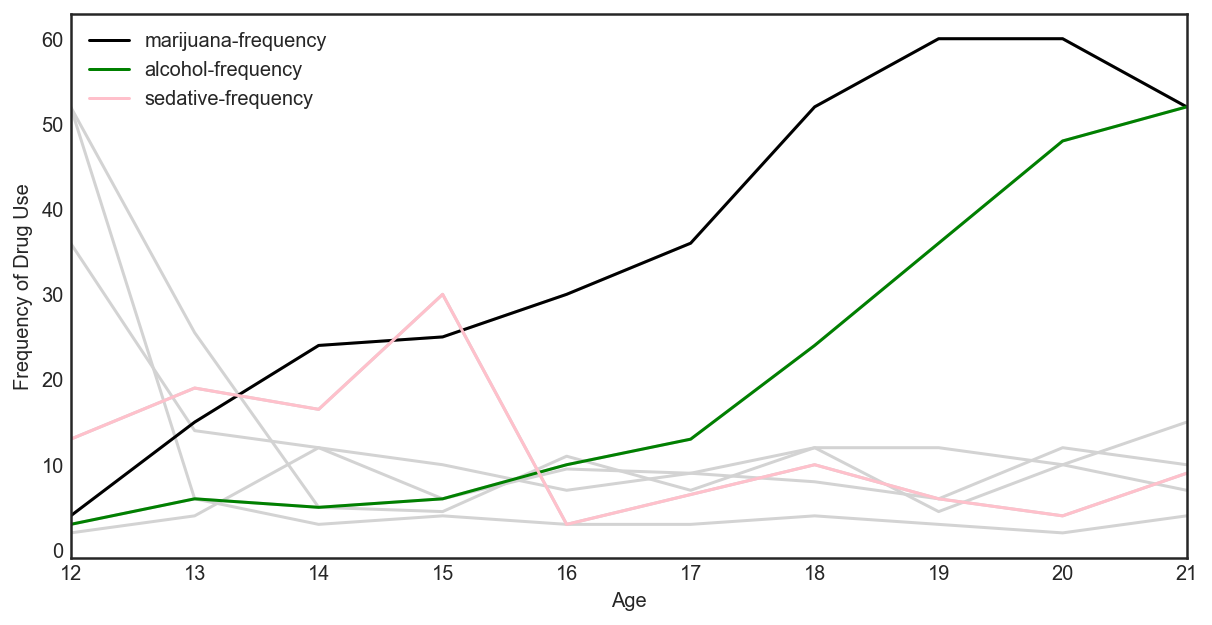
To understand why alcohol and marijuana usage is so predominant we look at their use among underage users. In America (where this data is from) the legal age for drinking in 21.
Figure 5: Frequency of drug use for deliquents greater than all other drugs
Full notebook here