Predicting house prices with the Ames dataset
Kaggle Competition - Advanced Regression Techniques
The Ames Housing Dataset is used by Kaggle (https://www.kaggle.com/c/house-prices-advanced-regression-techniques) participants to use multiple regression techniques to predict house prices given a set of features. It is the “Hello World” of Data Science problems.
My own attempt in the notebook here has three objectives:
- To estimate the sale price of properties based on their ‘fixed’ characteristics, such as neighborhood, lot size, number of stories etc
- To see what part of the residuals of (1) can be explained by the renovations to the house
- To determine the features in the housing data can predict abrnomal sales
The training set here is all house sales pre-2010 and the test-set is all houses sold in 2010.
A note about the target variable I am trying to predict the sale price of the house. Looking at the distribution of the sale prices it appears as though it follows a lognormal distribution as observed in the figure below. Most sale prices seem to lie between $100K-$200K, but there are a few outliers in houses selling for > $500K.
Figure 1: House Sale Prices appear to follow a LogNormal distribution

Taking the log of sale price, I end up with a target variable which follows as normal distribution. This means the Log of Sale Price can be deconstructed into the sum of separate features.
Feature Engineering
While the data itself is relatively clean, the biggest component of this project is the feature engineering. We have some a fair amount of missing data on most of the available features. The notebook details how I adjust for these missing values. After this, I derive several new features from the provided variables including:
- Number of rooms which are not bedrooms, bathrooms or kitchens
- Yard Area
- Ratio of Bathrooms to Bedrooms
- Basement Quality
Regression Models
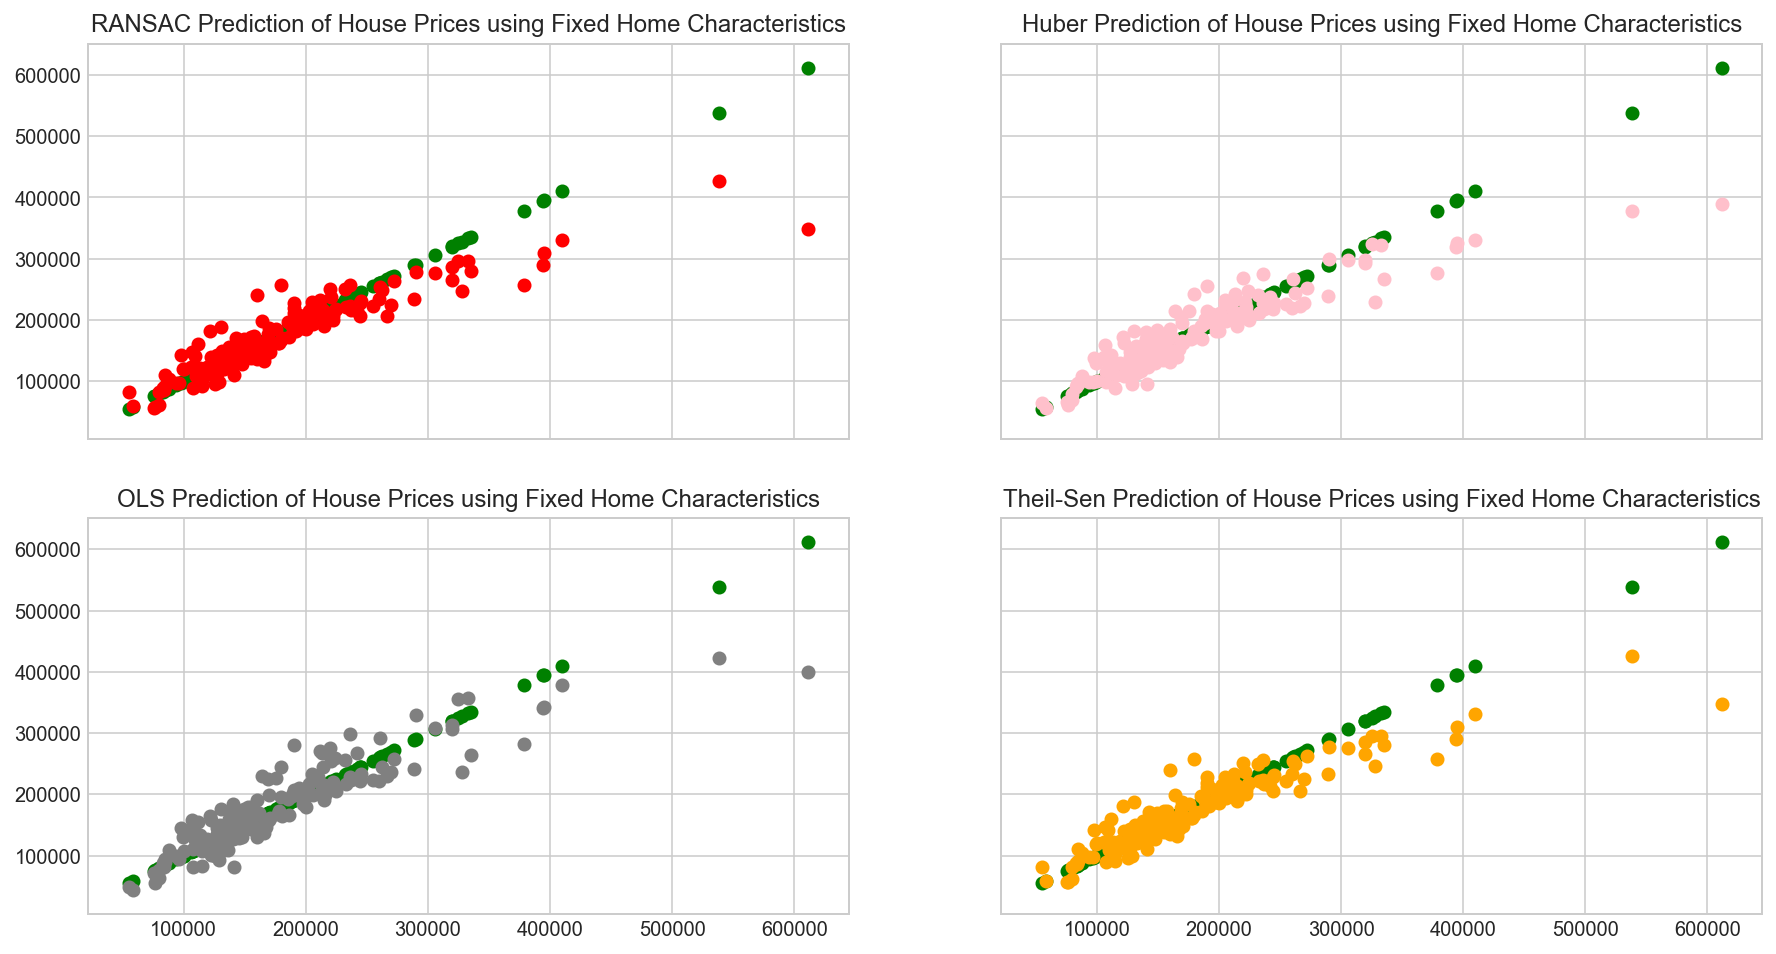
I use OLS, RANSAC, Huber and Theil-Sen regressors, to examine the relationship between the Sale Price and features - house attributes such as number of bedrooms etc. Figure 2 below shows that all models do well at predicting most house prices, but all models do poorly when trying to predict outlier prices.
Figure 2: Linear Regression Models capture most of the residuals

The green line represents the actual sale price of the house and the scatterplot represents the predicted price. The R-squared values of all four models is greater than 80%. The Theil Sen regressor explains upto 83.4% of the variance in the residuals of regressing fixed features against the sale price in the test set (pre-2010 house prices).
The top 3 fixed features most likely to affect the sale price of a house include:
- Greater Living Room Area
- Yard Area
- Total Basement Square Footage
Decision Trees
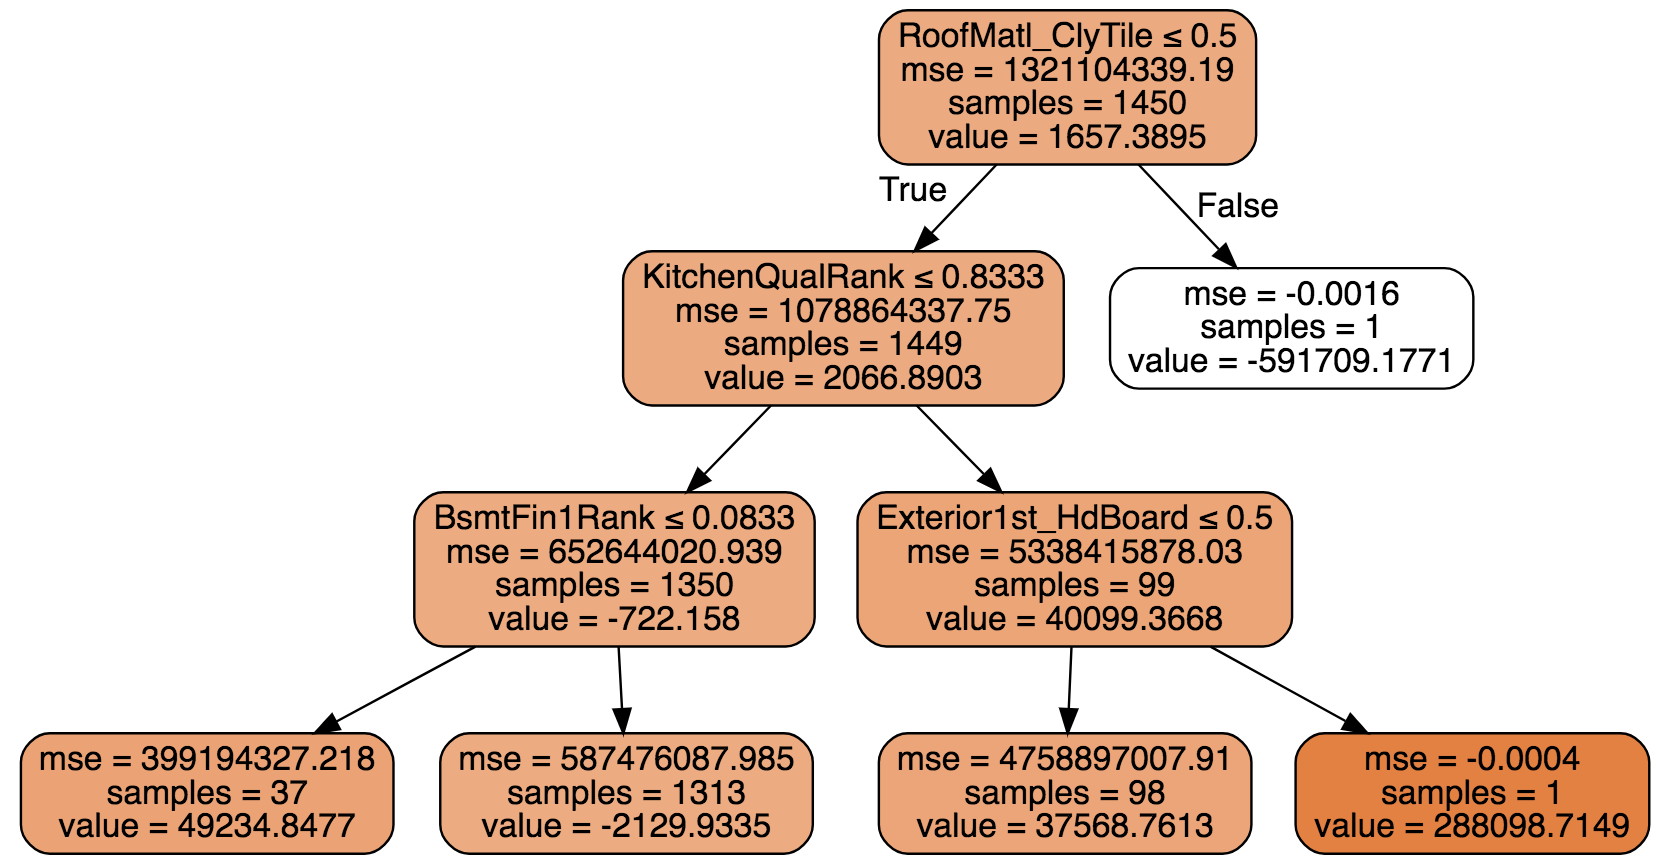
Figure 3: Decision Tree on the Residuals of the Theil Sen Regressor

The single most important factor to increasing the sale price of a home once all fixed factors have been accounted for is not using a clay tiled roof. Not using clay tiles adds $60,000+ to the value of a home. This would be the first means to renovate a house and flip it over.
Renovating a kitchen quality from fair to good or better, will add $40,000+ to the value of a house. Once this is done, rather surprisingly, the basement finishing is important. It appears that unfinished basements are worth $54,000 more than finished basements. This seems counterintuitive and may be caused by the tree overfitting, or maybe residents don’t want finished basements so that they can retool them to their liking.
For houses with non-clay roofs and good quality kitchens, ensuring the exterior covering material is Hard Board will add a further $10,000 to the value of the home.
Abnormal House Price Sales
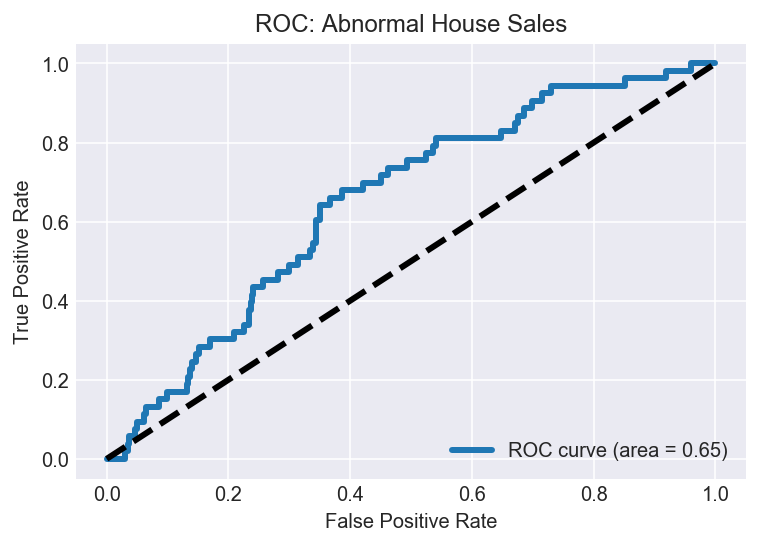
Certain houses have their condition classified as Abnormal. These types of sales are in the minority and trying to classify these sales will be affected by a class imbalance problem. Use of a ROC curve here, gives a good indication of how well we are able to predict abnormal sale prices. We note the ROC curve here is 65% which is better than simply using a dummy classifier.
*Figure 4: ROC Curve for Abnormal House Sales *

The complete notebook is available here